Reporting IIB / WMB flow statistics
MB-Precise can consume WMB/IIB statistics from a queue if enabled.
The below will enable statistics to be produced by the local broker to a queue. In this case the queue name will be “STATS”.
define qlocal(STATS) REPLACE
define sub(STATS_SUB) TOPICSTR(‘$SYS/Broker/+/StatisticsAccounting/Archive/#’) DEST(STATS)
Once the queue is setup, the statistics collection needs to be enabled in the execution group.
To enable statistics collection the broker node must be stopped by running :
mqsistop nodename
Change the broker statistics collection interval so it better aligns to our tests (in this case setting it to 2 minutes):
mqsichangebroker nodename -v 2
Restart the broker node with the new interval:
mqsistart nodename
We then clear any existing messages with a custom ANT task.
Enable the collection of flow statistics on the broker node:
mqsichangeflowstats nodename -e executionGroupName -j -a -c active -n advanced -o usertrace,xml -r
Once the collection is finished, we read all the messages from the STATS queue and transform them to an XML file that MB-Precise can process.
We can then inject the statistics along with our code when we run our SonarQube analysis.
sonar.mb.msgflow.stats.path=/statswork/stats.xml
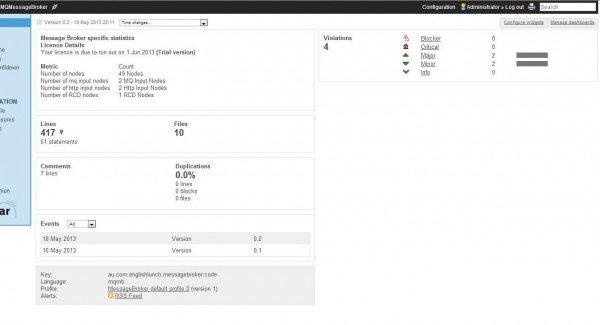
Now when we look at our SonarQube dashboard for our project we can view information about which flow and which node consumes the most processing.
 |
 |
We also include the flow and node statistics in the architectural overview diagrams that we generate from the source code.
This allow for developers, operations and architects to visualize resource consumption in the broader context of the code.
So a developer can view all the statistics for all flows:
 |
View all the statistics for all nodes:
 |
View the summary of a flow:
 |
And then the summary of the flow statistics:
 |
